

The Wyckoff Method offers a structured approach to trading that revolves around price action and volume. By understanding the dynamics of supply and demand, you can better identify market trends and potential reversals. This method emphasizes key market cycles, which can inform your trading decisions. As you explore its principles, you’ll see how institutional players — often referred to as the Composite Man — impact price movements. Understanding Smart Money Concepts alongside the Wyckoff Method could change your trading strategy considerably.
What is the Wyckoff Process?

The Wyckoff process is a trading methodology developed by Richard D. Wyckoff in the early 20th century, primarily aimed at understanding market movements through the analysis of supply and demand dynamics.
Central to the Wyckoff process are the concepts of “smart money” — institutional investors and their market activities — and the use of price and volume analysis to gauge market strength or weakness.
The Wyckoff method emphasizes a disciplined approach to trading, encouraging traders to remain aware of market conditions and adapt their strategies accordingly.
Is Wyckoff’s Strategy Profitable?
The Wyckoff theory promotes understanding market phases, aligning your trades with institutional movements, which can enhance profitability. By analyzing supply and demand through price action and volume, you can pinpoint ideal entry and exit points.
Historical data suggests that traders effectively applying the Wyckoff strategy achieve greater consistency, especially when combined with sound risk management. Using tools like stop-loss orders and proper position sizing protects your capital during unexpected market moves.
Key Principles of the Wyckoff Method
1. Price and Volume Analysis
Understanding price and volume analysis is essential. Key concepts include:
1. Price Movement: Significant price changes usually occur with corresponding changes in volume, indicating trend strength.
2. Supply and Demand: Prices rise with strong demand and fall when supply exceeds demand. Understanding liquidity dynamics helps you identify where these imbalances occur.
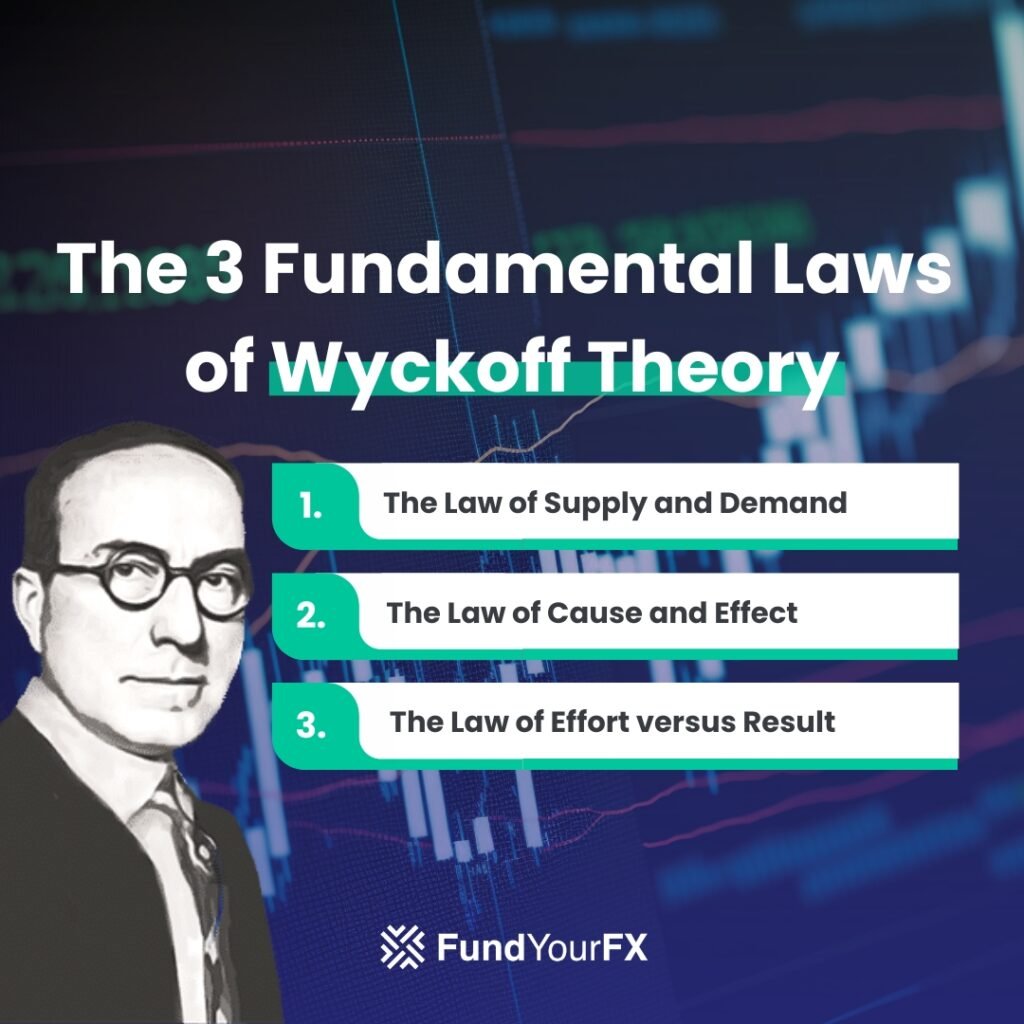
3. Cause and Effect: High volume during consolidation — often seen in price compression patterns — can lead to major price movements once the market breaks out.
4. Effort vs. Results: Divergences between price and volume can signal potential trend reversals. RSI divergence and MACD divergence provide additional confirmation of these Wyckoff signals.
2. Market Cycle Phases
The market cycle consists of four main phases: accumulation, markup, distribution, and markdown.
During accumulation, large institutional investors buy shares, forming a trading range. The markup phase follows, characterized by rising prices — this is where trend following strategies work best.
Next, distribution occurs as institutions sell off shares, resulting in a range-bound market with lower highs. Patterns like head and shoulders and double tops often form during distribution phases.
Finally, the markdown phase features heightened selling pressure and price declines. Watch out for bear traps during this phase that can shake out weak positions.
3. Supply and Demand Dynamics
Supply and demand dynamics form the cornerstone of the Wyckoff Method. Key aspects include:
1. The Law of Supply and Demand states that price direction relies on the balance between supply and demand.
2. Wide price bars closing high with high volume suggest strong demand, while low closing bars indicate significant supply. Learn to read these through candlestick chart analysis.
3. Identifying trading ranges is essential — support and resistance levels define these zones.
4. Point-and-Figure counts help measure cause and project potential effects.
The Wyckoff Market Cycle
In financial markets, recognizing the Wyckoff Market Cycle can greatly enhance your trading strategy. This cycle consists of four distinct phases: accumulation, markup, distribution, and markdown.
Understanding SMT divergence across correlated assets can help confirm which phase the market is in. During accumulation, market sentiment is typically bearish while smart money is buying — creating an opportunity for informed traders.
Applying the Wyckoff Method to Trading
To effectively utilize this method, follow these steps:
1. Determine the current market trend: Analyze price and volume. Watch central bank announcements and economic data releases that can trigger phase transitions.
2. Select correlated stocks or pairs: Choose assets that align with the overall market trend. Focus on the best forex pairs with sufficient liquidity.
3. Identify accumulation or distribution phases: Recognize these phases using Wyckoff schematics and chart patterns.
4. Assess readiness based on volume: Look for significant volume changes that indicate potential entry points. Have a clear trading plan with defined risk-to-reward targets.
Evaluating the Effectiveness of the Wyckoff Method

This method excels in identifying market phases and price action patterns. Its structured Five-Step Trading Strategy offers a clear framework for assessing trends.
However, the method’s complexity can be challenging for beginners — start with our guide to reading charts without indicators to build foundational price action skills. Understanding trading psychology is also crucial, as the Wyckoff Method requires patience through long accumulation phases. Avoid FOMO that can lead to premature entries.
Kesimpulan
The Wyckoff Method provides a structured approach to trading that focuses on price action and volume analysis. By understanding key principles and the market cycle, you can identify trends and make informed decisions. This method emphasizes supply and demand, allowing you to adapt your strategies based on market behavior. For traders looking to apply the Wyckoff Method with larger capital, consider becoming a funded trader through a prop firm.