
In forex trading, price compression happens when buying and selling forces are nearly balanced. This results in low volatility and a narrow trading range. Recognizing patterns like triangles and rectangles is key, as they indicate market uncertainty. Being able to identify compression can significantly improve your trading approach. Bollinger Bands help visualize periods of low volatility, signaling potential trading opportunities.
What Is Price Compression?

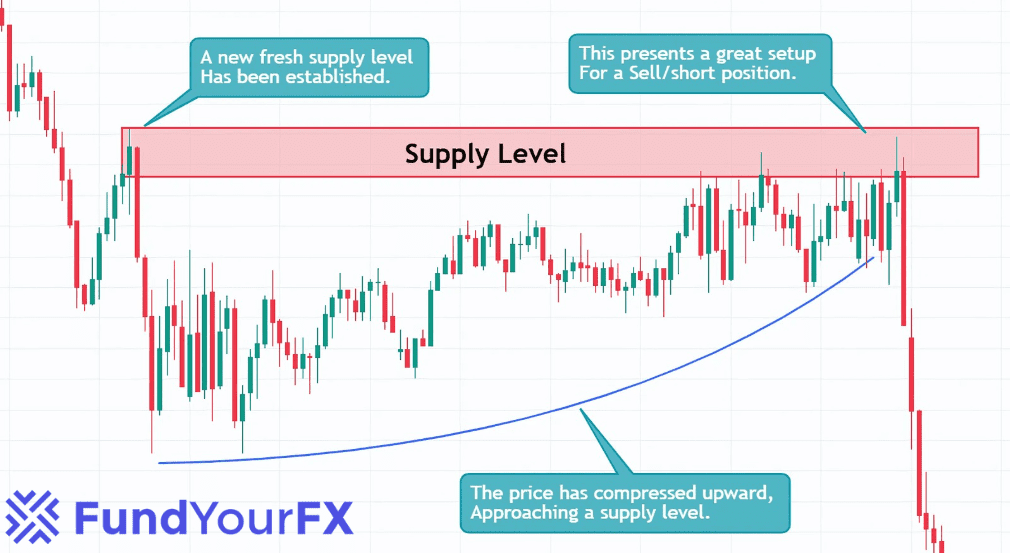
Price compression occurs when demand diminishes, leading to tight ranges before significant price shifts. You can spot these on charts through formations like triangles or rectangles at key support and resistance levels. The Wyckoff Method explains how institutions accumulate positions during compression before initiating breakouts. Understanding Smart Money Concepts helps you see where liquidity pools form during these tight ranges.
Identifying Price Compression Patterns
Triangle Patterns: Symmetrical, ascending, and descending triangles all signal market indecision before breakouts. These are among the most reliable chart patterns. Similar to flag pattern consolidation phases.
Rectangles: Price consolidation between established support and resistance.
Bollinger Band Squeezes: When bands narrow, it signals low volatility preceding a breakout.
Candlestick Clusters: Small-bodied candles like shooting stars and dojis indicate buildup of tension before significant moves. Learn to read candlestick charts for better compression identification.
Common Pitfalls in Price Compression Trading
1. Ignoring Volume Indicators: A breakout with high volume is a strong signal. Low volume breakouts often fail. Use Volume Spread Analysis to confirm.
2. Overtrading During Breakouts: Don’t let FOMO push you into every compression setup. Practice patience. Set stop-loss orders and use proper position sizing.
3. Misinterpreting Price Action: Jumping the gun before confirmation. Watch for bear traps and false breakouts. Confirm with RSI and MACD divergence. Don’t overlook macroeconomic factors and central bank announcements.
Real-Life Example

About 75% of breakouts happen in the direction of the prevailing trend. When you see small-bodied candles grouped closely, it signals indecision before a significant increase in volatility. Trade these breakouts during the most active sessions on liquid pairs. Maintain favorable risk-to-reward ratios and follow your trading plan.
Conclusión
Price compression indicates market indecision before notable price movements. Apply proper risk management and money management strategies. Avoid common mistakes and master trading psychology. For those wanting to trade compression breakouts with larger capital, consider becoming a funded trader.